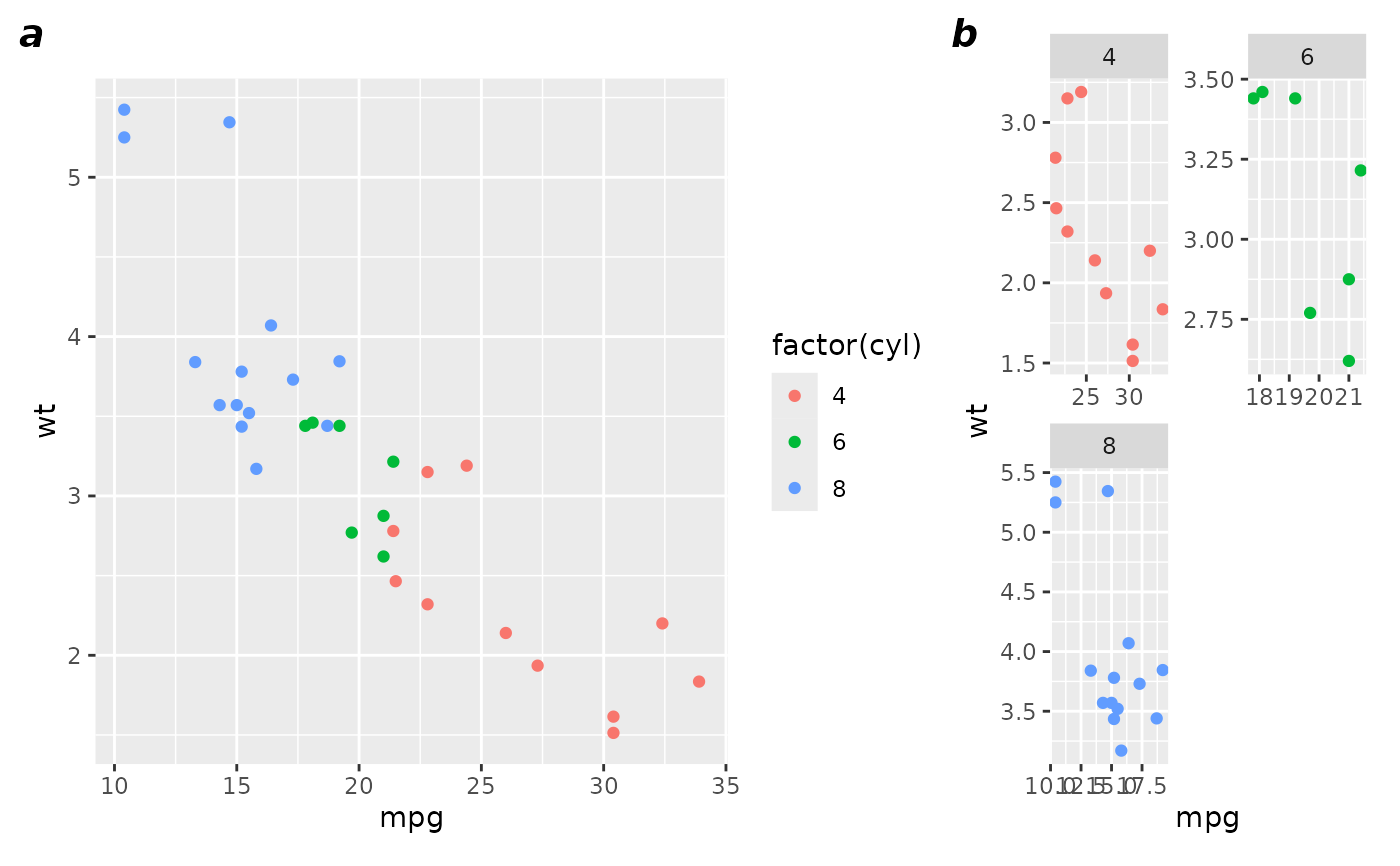
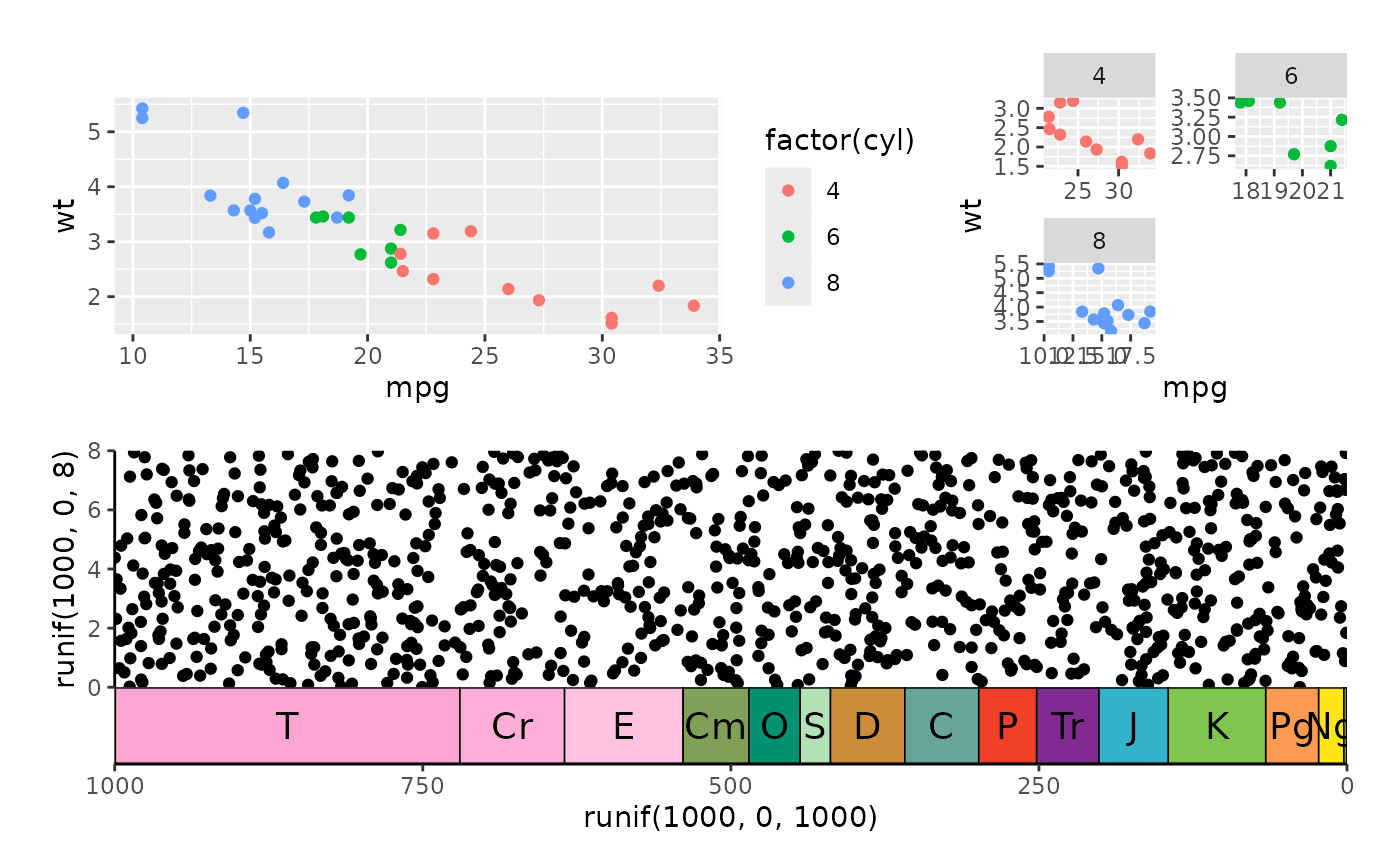
Arrange multiple ggplot, grobified ggplot, or geo_scale objects on a page, aligning the plot panels, axes, and axis titles.
Usage
ggarrange2(
  ...,
  plots = list(...),
  layout = NULL,
  nrow = NULL,
  ncol = NULL,
  widths = NULL,
  heights = NULL,
  byrow = TRUE,
  top = NULL,
  bottom = NULL,
  left = NULL,
  right = NULL,
  padding = unit(0.5, "line"),
  margin = unit(0.5, "line"),
  clip = "on",
  draw = TRUE,
  newpage = TRUE,
  debug = FALSE,
  labels = NULL,
  label.args = list(gp = gpar(font = 4, cex = 1.2))
)
Arguments
- ...
ggplot, grobified ggplot (gtable), or geo_scale objects
- plots
list of ggplot, gtable, or geo_scale objects
- layout
a matrix of integers specifying where each plot should go, like
matingraphics::layout();NAor a value less than 0 or greater than the number of plots indicates a blank plot; overrides nrow/ncol/byrow- nrow
number of rows
- ncol
number of columns
- widths
list of requested widths
- heights
list of requested heights
- byrow
logical, fill by rows
- top
optional string, or grob
- bottom
optional string, or grob
- left
optional string, or grob
- right
optional string, or grob
- padding
unit of length one, margin around annotations
- margin
vector of units of length 4: top, right, bottom, left (as in
gtable::gtable_add_padding())- clip
argument of gtable
- draw
logical: draw or return a grob
- newpage
logical: draw on a new page
- debug
logical, show layout with thin lines
- labels
character labels used for annotation of subfigures (should be in the same order as
plots)- label.args
label list of parameters for the formatting of labels
Examples
library(ggplot2)
p1 <- ggplot(mtcars, aes(mpg, wt, colour = factor(cyl))) +
  geom_point()
p2 <- ggplot(mtcars, aes(mpg, wt, colour = factor(cyl))) +
  geom_point() +
  facet_wrap(~cyl, ncol = 2, scales = "free") +
  guides(colour = "none") +
  theme()
ggarrange2(p1, p2, widths = c(2, 1), labels = c("a", "b"))


p3 <- ggplot() +
  geom_point(aes(y = runif(1000, 0, 8), x = runif(1000, 0, 1000))) +
  scale_x_reverse() +
  coord_geo(xlim = c(1000, 0), ylim = c(0, 8)) +
  theme_classic()
ggarrange2(ggarrange2(p1, p2, widths = c(2, 1), draw = FALSE), p3, nrow = 2)

