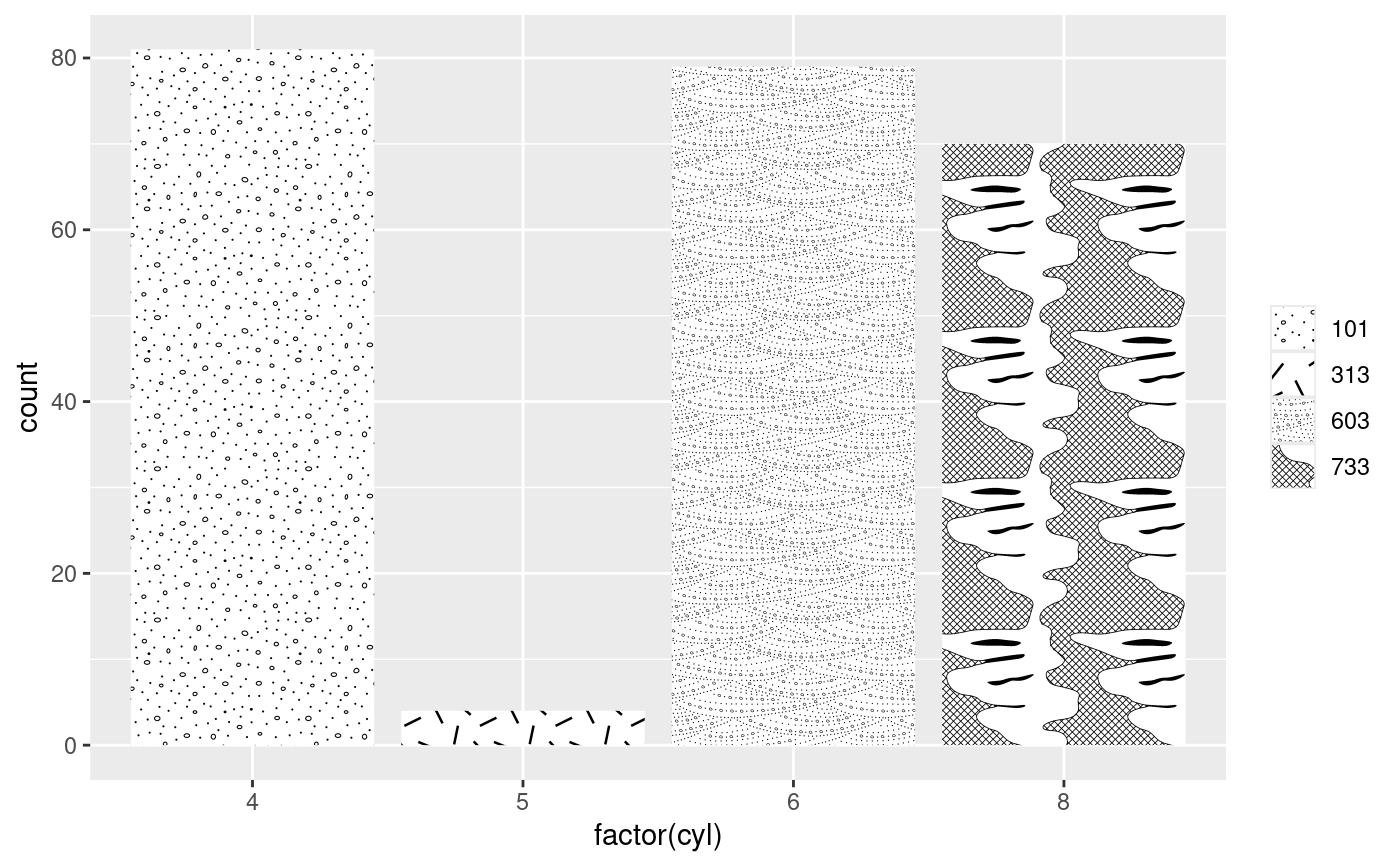
Fill scale using the FGDC Digital Cartographic Standard for Geologic Map Symbolization. Fill values should correspond to specific pattern codes (see "Details").
Arguments
- na.value
The aesthetic value to use for missing (NA) values. May be either a color or a GridPattern object (such as that returned by
geo_pattern()).- ...
Arguments passed on to
ggplot2::discrete_scalescale_name![[Deprecated]](figures/lifecycle-deprecated.svg) The name of the scale
that should be used for error messages associated with this scale.
The name of the scale
that should be used for error messages associated with this scale.nameThe name of the scale. Used as the axis or legend title. If
waiver(), the default, the name of the scale is taken from the first mapping used for that aesthetic. IfNULL, the legend title will be omitted.breaksOne of:
minor_breaksOne of:
NULLfor no minor breakswaiver()for the default breaks (none for discrete, one minor break between each major break for continuous)A numeric vector of positions
A function that given the limits returns a vector of minor breaks. Also accepts rlang lambda function notation. When the function has two arguments, it will be given the limits and major break positions.
labelsOne of the options below. Please note that when
labelsis a vector, it is highly recommended to also set thebreaksargument as a vector to protect against unintended mismatches.NULLfor no labelswaiver()for the default labels computed by the transformation objectA character vector giving labels (must be same length as
breaks)An expression vector (must be the same length as breaks). See ?plotmath for details.
A function that takes the breaks as input and returns labels as output. Also accepts rlang lambda function notation.
limitsOne of:
NULLto use the default scale valuesA character vector that defines possible values of the scale and their order
A function that accepts the existing (automatic) values and returns new ones. Also accepts rlang lambda function notation.
na.translateUnlike continuous scales, discrete scales can easily show missing values, and do so by default. If you want to remove missing values from a discrete scale, specify
na.translate = FALSE.dropShould unused factor levels be omitted from the scale? The default,
TRUE, uses the levels that appear in the data;FALSEincludes the levels in the factor. Please note that to display every level in a legend, the layer should useshow.legend = TRUE.guideA function used to create a guide or its name. See
guides()for more information.callThe
callused to construct the scale for reporting messages.
Details
For specific codes, see the "pattern numbers" in the full pattern chart
for valid code values. Daven Quinn has also assembled more accessible
documentation of the map patterns/codes
and lithology patterns/codes.
The set of patterns with names is also included in the built-in dataset
fgdc_names (and a label dictionary is available using fgdc_dict().
rmacrostrat::def_lithologies() can also be used to look up pattern codes
for various lithologies (see the "fill" column). Note that codes associated
with color variants (e.g., "101-M") are supported but will result in the
default color variant instead (usually black and white, e.g., "101-K").
These patterns were originally processed and optimized by Daven Quinn and are hosted on GitHub.
Warning
Pattern fills are not supported on all graphics devices.
Not all devices are under active development, and such devices are unlikely
to add support for new features (such as pattern fills). The new features
have only been implemented on a subset of graphics devices so far:
cairo_pdf(), cairo_ps(), x11(type="cairo"),
png(type="cairo"),
jpeg(type="cairo"),
tiff(type="cairo"), svg(), and pdf(). Although
there is no support yet for quartz() or windows(), almost all of the
graphics devices above will work on all major platforms. Further, the
ragg and
svglite packages contain graphics
devices that support patterns. When using a graphics device where patterns
are not supported, closed shapes will be rendered with a transparent fill.
Note that, at least on Windows machines, the default device in RStudio and
in the knitr package is png(), which does not support patterns. In
RStudio, you can go to ‘Tools > Global Options > General > Graphics’ and
choose the ‘Cairo PNG’ device from the dropdown menu to display patterns.
Similar issues may arise when using RStudio on other operating systems.
See also
FGDC patterns:
fgdc_dict(),
fgdc_names,
geo_pattern(),
grid.pattern_geo()